相关性(correlation)和回归(regression)的区别
主要区别-相关与回归
相关和回归是统计学中用来研究变量之间关系的两种方法。相关性和回归的主要区别在于相关性衡量两个变量之间的关联程度,而回归是描述两个变量之间关系的一种方法。回归还可以更准确地预测因变量对自变量给定值的取值。
什么是相关性(correlation)?
In statistics, we say there is a correlation between two variables if the two variables are related. If the relati***hip between the variables is a linear one, we can express the degree to which they are related using a number called Pearson’s correlation coefficient . takes a value between -1 and 1. A value of 0 means that the two variables are uncorrelated. Negative values indicate that the correlation between the variables is negative: i.e. as one variable increases, the other variable decreases. Similarly, a positive value for means that the data is positively correlated (when one variable increases, the other variable increases too).
A value of that is -1 or 1 gives the strongest possible correlation. When the variables are said to be completely negatively correlated and when the values are said to be completely positively correlated. The figure below shows several shapes of scatter plots between two variables and the correlation coefficient for each case:
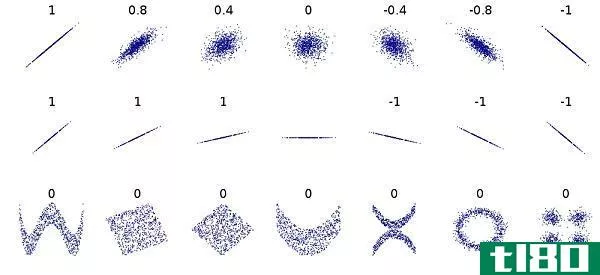
Pearson’s correlation coefficient for different types of scatter plots
Pearson’s correlation coefficient for two variables and is defined as follows:
Here, is the covariance between and :
The terms and stand for standard deviati*** of and respectively.This is defined as:
and
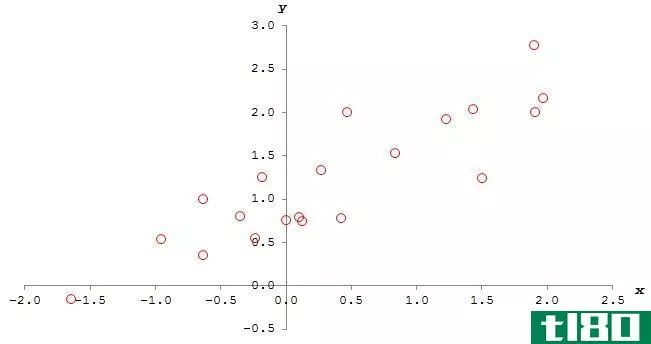
Let us see how the correlation coefficient is calculated using an example. We will try to calculate the correlation coefficient for the following set of 20 values for and :
| -0.9557 | 0.5369 |
| -1.6441 | -0.1560 |
| 1.2254 | 1.9230 |
| 1.9062 | 1.9957 |
| 1.9679 | 2.1673 |
| -0.3469 | 0.7954 |
| -0.2328 | 0.5415 |
| 1.5064 | 1.2335 |
| 0.4278 | 0.7754 |
| -0.6359 | 0.3534 |
| 0.0061 | 0.7565 |
| 0.8407 | 1.5326 |
| 0.2713 | 1.3354 |
| 0.4664 | 1.9980 |
| -0.1813 | 1.2539 |
| 1.4384 | 2.0383 |
| 1.9001 | 2.7755 |
| 0.1022 | 0.7861 |
| 0.1251 | 0.7456 |
| -0.6314 | 0.9942 |
The values of are plotted against the values of on the graph shown below:
Looking at the equati*** needed to calculate the correlation coefficient, we will first calculate values for . These are the mean values of and respectively. We find that:
Next, we will calculate and . We will put these values next to our values of and on the table above:
| -0.9557 | 0.5369 | -0.5131 | 1.7782 | 0.4654 |
| -1.6441 | -0.1560 | 0.2565 | 4.0881 | 1.8909 |
| 1.2254 | 1.9230 | 2.3564 | 0.7184 | 0.4955 |
| 1.9062 | 1.9957 | 3.8042 | 2.3360 | 0.6031 |
| 1.9679 | 2.1673 | 4.2650 | 2.5284 | 0.8991 |
| -0.3469 | 0.7954 | -0.2759 | 0.5252 | 0.1795 |
| -0.2328 | 0.5415 | -0.1261 | 0.3728 | 0.4592 |
| 1.5064 | 1.2335 | 1.8581 | 1.2737 | 0.0002 |
| 0.4278 | 0.7754 | 0.3317 | 0.0025 | 0.1969 |
| -0.6359 | 0.3534 | -0.2247 | 1.0276 | 0.7495 |
| 0.0061 | 0.7565 | 0.0046 | 0.1382 | 0.2140 |
| 0.8407 | 1.5326 | 1.2885 | 0.2143 | 0.0983 |
| 0.2713 | 1.3354 | 0.3623 | 0.0113 | 0.0135 |
| 0.4664 | 1.9980 | 0.9319 | 0.0079 | 0.6067 |
| -0.1813 | 1.2539 | -0.2273 | 0.3126 | 0.0012 |
| 1.4384 | 2.0383 | 2.9319 | 1.1249 | 0.6711 |
| 1.9001 | 2.7755 | 5.2737 | 2.3174 | 2.4223 |
| 0.1022 | 0.7861 | 0.0803 | 0.0760 | 0.1875 |
| 0.1251 | 0.7456 | 0.0933 | 0.0639 | 0.2242 |
| -0.6314 | 0.9942 | -0.6277 | 1.0185 | 0.0506 |
利用这些值,我们可以计算协方差:
我们还可以计算标准偏差:
现在我们可以计算相关系数:
什么是回归(regression)?
Regression is a method for finding the relati***hip between two variables. Specifically, we will look at linear regression, which gives an equation for a “line of best fit” for a given sample of data, where two variables have a linear relati***hip. A straight line can be described with an equation in the form of where is the gradient of the line and axis, and linear regression allows us to calculate the values of and . Once we have calculated the correlation coefficient , we can calculate these values as:
Note that in these cases, is taken to be the dependent variable while is the independent variable. From our previous calculati***, we know that
, and . Therefore, .
and . Therefore, .
The image below shows the previous scatter plot with the line :
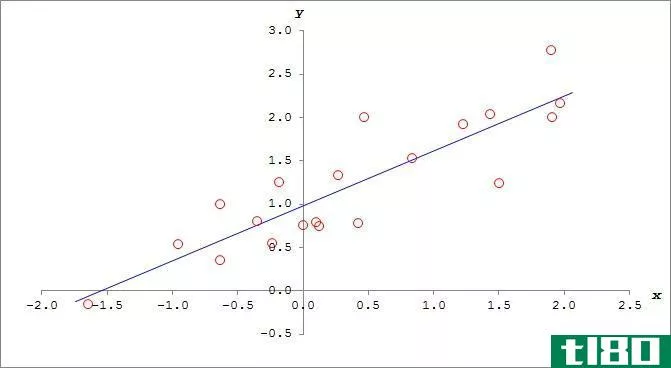
The data, with the best-fitting straight line obtained from regression ****ysis
As we mentioned before, regression ****ysis aids us to make predicti***. For instance, if the value of the independent variable ( ) was 1.000, then we can predict that would be close to . In reality, the value of may not necessarily be exactly 1.614. Due to uncertainty, the actual value is likely to be different. Note that the accuracy of the prediction is higher for data with a correlation coefficient closer to ±1.
相关性(correlation)和回归(regression)的区别
描述关系
相关性描述了两个变量的相关程度。
回归给出了一种寻找两个变量之间关系的方法。
做预测
相关性仅仅描述了两个变量的相关性。分析两个变量之间的相关性并不能提高对自变量给定值预测因变量值的准确性。
回归使我们能够更准确地预测自变量给定值的因变量值。
变量之间的依赖关系
在分析相关性时,哪个变量是独立的,哪个是独立的并不重要。
在分析回归时,有必要区分因变量和自变量。
Image Courtesy:
“redesign File:Correlation_examples.png using vector graphics (SVG file)” by DenisBoigelot (Own work, original uploader was Imagecreator) [CC0 1.0], via Wikimedia Comm***
- 发表于 2021-06-27 11:05
- 阅读 ( 904 )
- 分类:科学
你可能感兴趣的文章

进步的(progressive)和回归染色(regressive staining)的区别
...酸酒精中进行鉴别来去除多余的污渍。 什么是回归染色(regressive staining)? 回归染色是一种更快速的染色技术,其中组织被故意过度染色,直到染料浸透所有组织成分。然后组织被选择性地去染色,直到它到达正确的终点。去染...
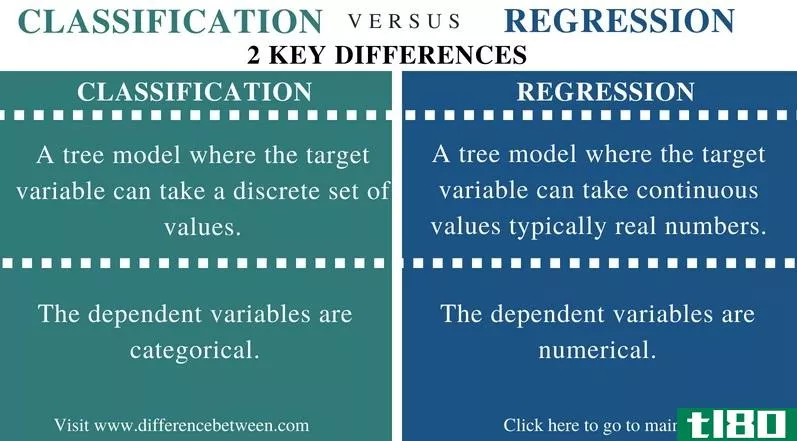
分类(classification)和回归(regression)的区别
...组。它旨在阐明因变量所带来的分类反应。 什么是回归(regression)? 回归是一种基于假定或已知的数值输出值的预测方法。这个输出值是一系列递归分区的结果,每个步骤都有一个数值和另一组因变量,这些变量会分支到另一对...

如何用excel求相关系数
最简单和最常见的统计Excel计算之一是相关性。这是一个简单的统计数据,但当你想知道两个变量是否相关时,它可以提供很多信息。如果你知道正确的命令,在Excel中找到相关系数是非常容易的。 ...

方差分析之间的差异(difference betweeen anova)和回归(regression)的区别
...析模型来完成。方差分析模型的检验结果可用于回归公式相关性的F检验。 方差分析主要用于确定不同组的数据是否有共同的均值。回归广泛用于预测和预测。它还用于查看哪个自变量与因变量相关。回归的第一种形式可以在勒...
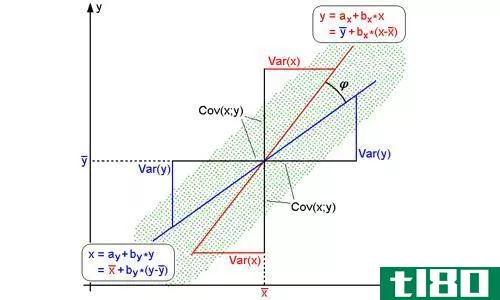
协方差(covariance)和相关性(correlation)的区别
...量的期望值与它们的期望值之间的变化的期望值”,而“相关性”则是“两个随机变量的期望值”。为了简化,协方差试图研究和测量变量一起变化的程度。在这个概念中,两个变量可以以相同的方式改变,而不表示任何关系。...
相关性之间的差异(differences between correlation)和回归(regression)的区别
...因变量幅度的变化,那么这两个变量被称为是相关的。 相关性可以是线性的,也可以是非线性的。线性相关性是指变量之间的相关性使得一个变量值的变化会导致另一个变量值的变化。在线性相关中,与因变量和自变量的各自...
相关性(correlation)和回归(regression)的区别
...关和回归是统计学中用来研究变量之间关系的两种方法。相关性和回归的主要区别在于相关性衡量两个变量之间的关联程度,而回归是描述两个变量之间关系的一种方法。回归还可以更准确地预测因变量对自变量给定值的取值。...

线性回归(linear regression)和逻辑回归(logistic regression)的区别
... 线性回归,逻辑回归,机器学习 什么是线性回归(linear regression)? 线性回归发现自变量和因变量之间的关系。它们都是相邻的。自变量是不被其他变量改变的变量。用x表示。也可以有多个自变量,如x1、x2、x3等。因变量根据自...

神志正常(sanity)和回归测试(regression testing)的区别
...,并确保软件已准备好进行主要测试。 什么是回归测试(regression testing)? 回归测试是检查代码修改并确保它们不会造成任何意外的不利影响的测试类型。例如,考虑具有当前余额和传输模块的银行应用程序。例如,假设开发人...

相关性(correlation)和回归(regression)的区别
统计界最常用的两个术语是相关性和回归。这两个术语被称为“分析”,因为它们是基于众多变量的传播。这种现象通常被称为多元分布。当需要检查两个定量变量之间的关联时,它们最常用。受访者最有可能被问及相关和回归...
0 篇文章


